

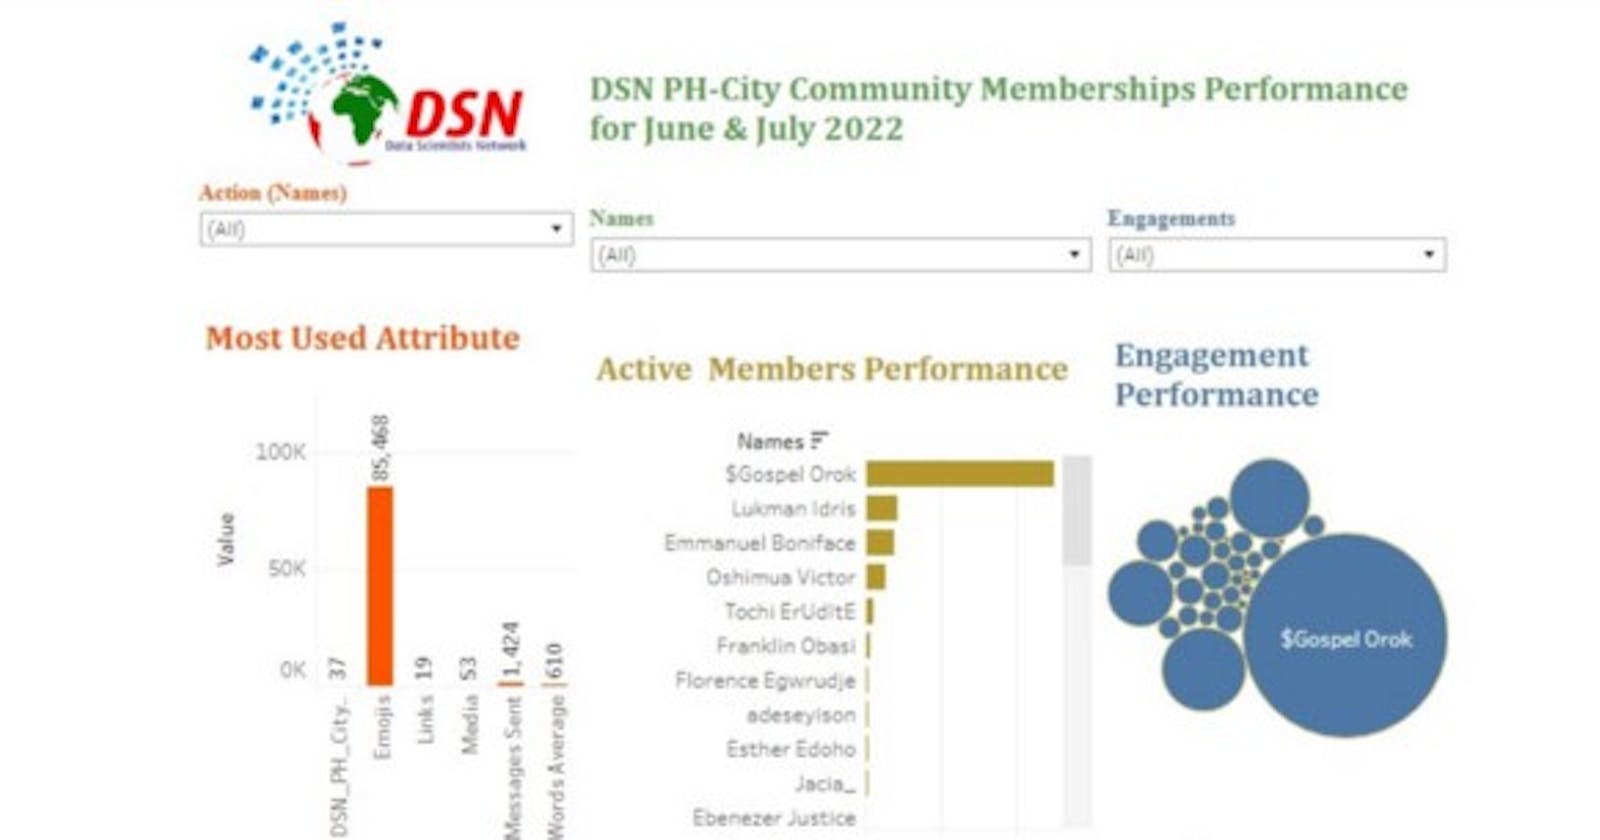


The Tableau visualization dashboard for this analysis can be found here
Introduction
DSN PH-city community is a Data Scientists Network/Data Science Nigeria(DSN) AI+ community. It is a platform for individuals within Port Harcourt, Rivers State who are passionate about AI and the data driven ecosystem. This community cuts across beginners, intermediates and professionals without any barriers with tribe, religion, or other socio-economic status.
The general aim of the community is to promote the goals and vision of DSN which is “to raise 1 million AI talents in Nigeria and prepare them for the future of work, while developing Artificial Intelligence solutions to improve the quality of life of 2 billion people in emerging markets”.
This Article will explain how WhatsApp analysis can be done for a data science or tech community and also provides a great way of playing with the WhatsApp dataset by leveraging data manipulation skills, data cleaning techniques, working with different file formats such as .csv, .txt, handling timestamp data, and applying visualization techniques to aid in decision making towards community growth and impact.
Why We Chose WhatsApp Platform for our Community Group Activities
We initially started out with using Slack for our community engagements but later migrated to WhatsApp because of the past performance feedback we had.
Downsides of the previous platform
- The downside of using slack was that we discovered several community members were not comfortable and familiar with the platform, especially in navigating through the various channels and threads. Only few members were able to navigate with ease .
- Subsequently, since we already had a WhatsApp group and most of our community information was being circulated on the platform. We discovered that members were more active on WhatsApp and reachable than on previous platform.
- WhatsApp is one of the most popular messaging apps with about 2 billion users. Its features are free and fast in a layman’s language. It’s fun to interact with. Since most users have their family and friends there, college groups, church groups. Sometimes it feels nice to interact with them and cherish the old memories.
- Also, various professional groups utilize WhatsApp as their primary communications channel due to its promptness and effectiveness in sharing information.

The effectiveness of WhatsApp to DSN Ph-city community
- DSN Port Harcourt city community has established a membership of over 65 individuals on the WhatsApp group where most of the community engagements and activities are carried out.
- Considering how widely used WhatsApp is, huge amount of data is generated daily with more than 65 billion messages sent everyday. As Data analysts and scientists, we know data is the new crude oil which can be processed to derive useful insights for better decision making.
- Hence, we can use WhatsApp’s data for many data science tasks like sentiment analysis, keyword extraction, named entity recognition, text analysis and several other natural language processing tasks. A lot of information from WhatsApp chats and groups can help solve problems.
The Analysis
This analysis was carried out to evaluate the following key insights about the group:
- Get the dataset ready
- Size of the dataset
- Visualize yearly performance of the group
- Visualize monthly performance of the group for 2022
- Total number of contacts on the group
- Get size of dataset based on dates from June to July 2022
- The total message showing activities on group for the June & July 2022 period
- Top 10 active members
- 10 least active members
- Visualize the most used word by members of the group with word cloud and yourself or any other member
- Optional: sentiment Analysis
Now let’s run through the steps for the Analysis
Getting the Dataset
To extract your WhatsApp chats, just open any whatsApp chat or group and follow the steps mentioned below:

- Using an iPhone, tap on the contact name or group name. On an Android phone tap on the 3 dots above.
- Scroll to the bottom and tap on Export Chat.
- You can select without media for simplicity if you’re prompted to choose with or without media.
- Then email the chat txt file to yourself and download it to your system.
- This is how you can easily get your WhatsApp chats with any person or a group to perform a chat analysis.
Next, open your python editor e.g Visual Studio or Jupyter notebook etc and pip install the following necessary Python libraries if you do not have them on your editor:
pip install regex
pip install emoji
pip install wordcloud
pip install textblob
pip install nltk
Now let’s import the necessary Python libraries:
import pandas as pd                       #for data manipulation
import numpy as np                        #for numerical computation
import matplotlib.pyplot as plt           #for visualization
import plotly.express as px               #for visualization
import seaborn as sns                     #for visualization
import regex                              #for text extraction
import emoji
from collections import Counter
from wordcloud import WordCloud, STOPWORDS, ImageColorGenerator
from textblob import TextBlob             #for sentiment analysis
Next, the dataset we are using here requires a lot of preparation, so let’s get some codes that will help us prepare the dataset. Since the data is in txt format we need to make use of regex scripts to aid our data extraction:
def date\_time(s):              #Extract Time
     pattern = ‘^(\[0–9\]+)(\\/)(\[0–9\]+)(\\/)(\[0–9\]+), (\[0–9\]+):(\[0–9\]+)   \[ \]?(AM|PM|am|pm)? -’
    result = regex.match(pattern, s)
    if result:
            return True
 return False
\# Find Authors or Contacts
def find\_author(s):
      s = s.split(“:”)
     if len(s)==2:
           return True
    else:
          return False
 #Finding Messages
def getDatapoint(line):
       splitline = line.split(‘ — ‘)
       dateTime = splitline\[0\]
       date, time = dateTime.split(“, “)
 message = “ “.join(splitline\[1:\])
 if find\_author(message):
         splitmessage = message.split(“: “)
         author = splitmessage\[0\]
         message = “ “.join(splitmessage\[1:\])
 else:
        author= None
 return date, time, author, message
Now let’s import the data and prepare it in a way that we can use it in a pandas DataFrame:
data = \[\] #let’s track the data into a list for Pandas dataframe
conversation = ‘WhatsApp Chat with AI+ PH.txt’ #Chat downloaded from community group
with open(conversation, encoding=”utf-8") as fp:
       fp.readline()
       messageBuffer = \[\]
       date, time, author = None, None, None
      while True:
               line = fp.readline()
               if not line:
                    break
              line = line.strip()
              if date\_time(line):
                     if len(messageBuffer) > 0:
                            data.append(\[date, time, author, ‘ ‘.join(messageBuffer)\])
                     messageBuffer.clear()
                     date, time, author, message = getDatapoint(line)
                     messageBuffer.append(message)
            else:
                   messageBuffer.append(line)

df = pd.DataFrame(data, columns=\[“Date”, ‘Time’, ‘Author’,’Message’\]) #Load to pandas df
df\[‘Date’\] = pd.to\_datetime(df\[‘Date’\]) #Convert date to pandas datetime
Let’s get the Size of the dataset and other necessary information about the dataset.
df.shape[0]
Data Transformation: you can create year, month, day columns
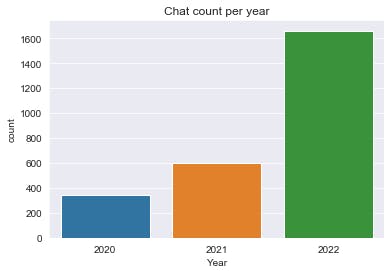
Let’s get the yearly performance of the group.
import matplotlib.pyplot as plt #you visualize yearly performance of the group
import seaborn as sns
%matplotlib inline
sns.set\_style(‘darkgrid’ )
sns.countplot(df.Year).set\_title(‘Chat count per year’)
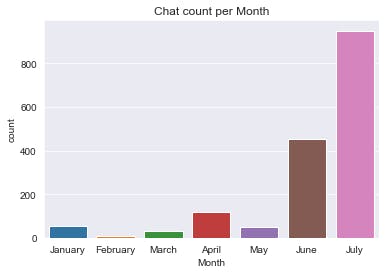
Let’s get the Monthly performance of the group for 2022
df\_pm=df.loc\[(df\[‘Date’\]>=’2022–01–01')&(df\[‘Date’\]<’2022–08–01')\]
sns.set\_style(‘darkgrid’ ) #you visualize monthly performance of the group for 2022
sns.countplot(df\_pm.Month).set\_title(‘Chat count per Month’)
Total number of active contacts in the group
df.Author.nunique()

Total number of active contacts in the group
Dataset from June to July 2022
df=df.loc\[(df\[‘Date’\]>=’2022–06–01')&(df\[‘Date’\]<’2022–08–01')\]
df
Number of active contacts in the group
df.Author.nunique()

Number of active contacts in the group
Now let’s prepare the data to get more insights to analyse in detail all the messages sent in the chat.
unique\_numb=df.Author.unique() #to grab the unique contacts
l=unique\_numb.tolist()
#to prepare and preprocess messages
media\_messages\_df = df\[df\[‘Message’\] == ‘<Media omitted>’\]
messages\_df = df.drop(media\_messages\_df.index)
messages\_df\[‘Letter\_Count’\] = messages\_df\[‘Message’\].apply(lambda s : len(s))
messages\_df\[‘Word\_Count’\] = messages\_df\[‘Message’\].apply(lambda s : len(s.split(‘ ‘)))
messages\_df\[“MessageCount”\]=1
action\_dict=\[\]
for i in range(len(l)):
     #Filtering out messages of particular user
     req\_df= messages\_df\[messages\_df\[“Author”\] == l\[i\]\] #req\_df will contain messages of only one
     particular user
     namem=l\[i\] #to get names or each contact in the list
     messag\_sent=req\_df.shape\[0\] #shape will print number of rows which indirectly means the number
     of messages
     #Word\_Count contains of total words in one message. Sum of all words/ Total Messages will yield
     words per message
     words\_per\_message = (np.sum(req\_df\[‘Word\_Count’\]))/req\_df.shape\[0\]
     media = media\_messages\_df\[media\_messages\_df\[‘Author’\] == l\[i\]\].shape\[0\] #media conists of
     media messages
     emojis = sum(req\_df\[‘emoji’\].str.len())#emojis consists of total emojis
     links = sum(req\_df\[“urlcount”\]) #links consist of total links
     #to append or add variables to empty list
     action\_dict.append(\[namem,messag\_sent,int(words\_per\_message),media,emojis,links\])

active\_list = pd.DataFrame(action\_dict, columns=\[‘names’,’messages\_sent’,’words\_average’,”Media”,”Emojis”,”Links”\])

#finding total count
active\_list\[‘Total’\]=active\_list\[‘messages\_sent’\]+active\_list\[‘words\_average’\]+active\_list\[‘Media’\]+active\_list\[‘Emojis’\]+active\_list\[‘Links’\]
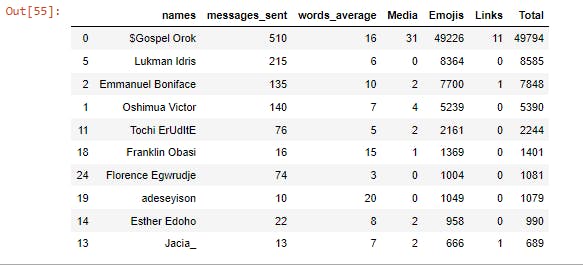
Top 10 Active Members
top\_list=list.head(10)
top\_list
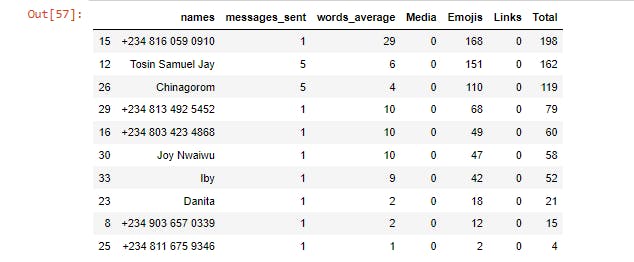
Least 10 Active Members
least\_1ist=list.tail(10)
least\_1ist
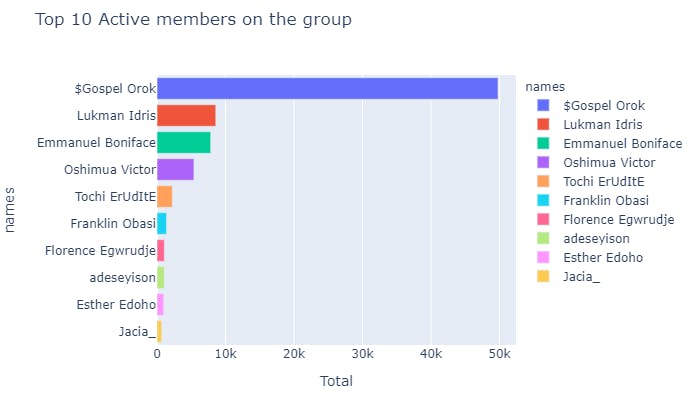
Bar chart for the Top 10 Active Members
#ploting barchart horizontally
#import plotly.express as px
top\_list=top\_list.sort\_values(by=\[‘Total’\],ascending=False)
fig1=px.bar(top\_list,x=’Total’,y=’names’, color=’names’,title=’Top 10 Active members on the group’)
fig1.show()
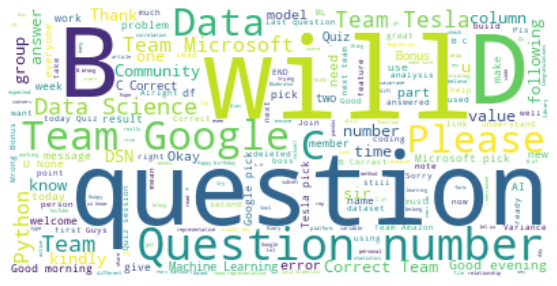
Now let’s have a look at the most used words in this WhatsApp chat by visualizing a word cloud.
text = " ".join(review for review in messages\_df.Message)
print ("There are {} words in all the messages.".format(len(text)))
stopwords = set(STOPWORDS)
\# Generate a word cloud image
wordcloud = WordCloud(stopwords=stopwords, background\_color="white").generate(text)
\# Display the generated image:
\# the matplotlib way:
plt.figure( figsize=(10,5))
plt.imshow(wordcloud, interpolation='bilinear')
plt.axis("off")
plt.show()
This is how I analysed DSN Port Harcourt city community WhatsApp Group. Performing the analysis is simple but the most tedious part is cleaning and pre-processing the WhatsApp group data from .txt format to a ready-to use csv format for the analysis.
WhatsApp data can still be used for many other tasks of natural language processing within the scope. It can be used for sentiment analysis and text extraction.
The notebook for this analysis can be found on my Github.
Summary
From the analysis, out of 86 members, we have 37 persons proven active on the group between the period of June and July 2022. The top 10 active members and the 10 least active members result was gotten through the accumulative attributes used by the members such as messages, emoji's, links etc. The top 10 active members engaged in sharing articles written by them and also in sharing other helpful resources. Most of them also volunteered for the weekly knowledge quest. This analysis provides an easy means of proving our community report to DSN, this also helped us in setting targets on improving our community impact.
I also created a dashboard using Tableau for visualization. The dashboard can be found here.
As a data science and AI enabling community, we have realized that the job market is very competitive, so our next step for the community growth and in also boosting engagement with inactive members is to make sure our members are job market ready, this will be possible through our weekly online and in person data science quest quiz and projects. The quiz and projects is targeted on data science job interview questions and projects for placement in top companies like Google, Amazon, Microsoft etc. As a growing community we believe that “none of us is as smart as all of us”. Kudus to Data Scientists Network/Data Science Nigeria for this great opportunity and platform.
Thanks for visiting my work.
Feel free to join our DSN community and also follow me on Twitter: Orok Gospel